

Image Details
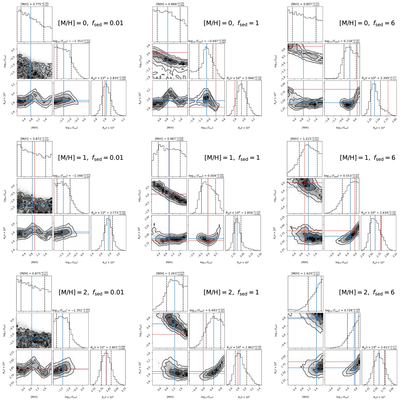
Caption: Figure 10.
Posterior distributions from MCMC fits to the synthetic VIS4 photometry generated in Scenario A. Each panel corresponds to one atmospheric input case. The marginal titles report the posterior median and the 16th and 84th percentiles. Blue lines indicate the posterior medians, and red lines indicate the input parameter values. The contours illustrate the degeneracies between the spectral-shape parameters and the reflected-light amplitude and show how upper-limit-dominated bands broaden the posterior volume.
Other Images in This Article
Show More
Copyright and Terms & Conditions
© 2026. The Author(s). Published by the American Astronomical Society.

Copyright ©
2026 Astronomy Image Explorer. All Rights Reserved.
