

Image Details
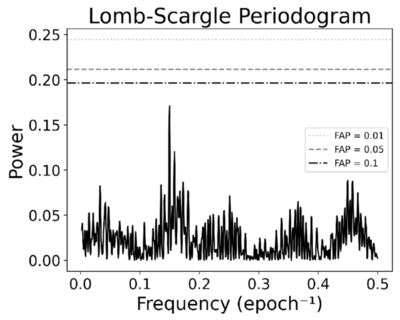
Caption: Figure 4.
A frequency Lomb–Scargle periodogram of the π Men c O – C plot. The false-alarm probabilities (FAP) = 0.1, 0.05, and 0.01, measurements conditioned on the assumption of the null hypothesis of no signal, are shown as horizontal lines. Note that none of the periodogram peaks rise above any of the FAP thresholds, and as such, our O – C plot is consistent with a lack of TTVs.
Other Images in This Article
Copyright and Terms & Conditions
© 2026. The Author(s). Published by the American Astronomical Society.

Copyright ©
2026 Astronomy Image Explorer. All Rights Reserved.
