

Image Details
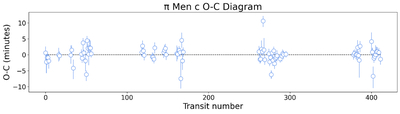
Caption: Figure 2.
O – C plot of π Men c transit midpoints. Midpoints are designated by epoch, and differences are in units of minutes. The dotted black line traces the path of expected transit-midpoint values (in other words, the line where δtn = 0). We find our O – C plot to be consistent with a lack of TTVs.
Other Images in This Article
Copyright and Terms & Conditions
© 2026. The Author(s). Published by the American Astronomical Society.

Copyright ©
2026 Astronomy Image Explorer. All Rights Reserved.
