

Image Details
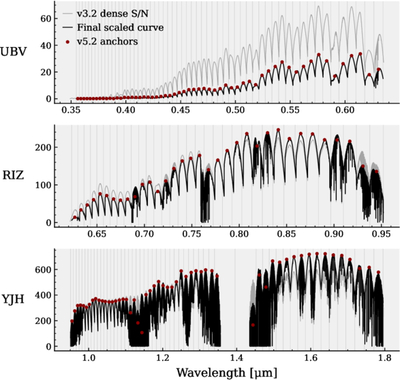
Caption: Figure 3.
Construction of the ETC S/N curve, shown here for TRAPPIST-1 and a 600 s reference exposure. The red points show the representative S/N anchors from v.5.2, which set the absolute normalization. The gray curves show the densely sampled wavelength structure from v.3.2. For each v.5.2 anchor, we compute a local multiplicative scale factor (Equation (8)) and apply it to the corresponding v.3.2 wavelength interval. The resulting scaled S/N curve is shown in black. Thin vertical lines indicate the wavelength intervals assigned to each v.5.2 anchor point.
Other Images in This Article
Copyright and Terms & Conditions
© 2026. The Author(s). Published by the American Astronomical Society.

Copyright ©
2026 Astronomy Image Explorer. All Rights Reserved.
