

Image Details
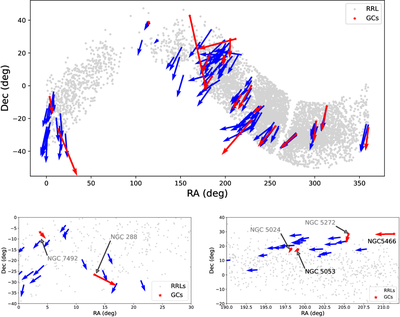
Caption: Figure 4.
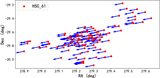
The upper panel shows the distribution of RRLs and GCs in R.A. and decl., along with the demonstration of proper-motion directions. Red arrows denote the position and proper-motion directions of the GCs, while blue arrows indicate the position and proper-motion directions of the six nearest RRL variables around the GCs in three-dimensional coordinates. Gray points represent the RRLs. The two lower panels are enlarged views of the regions with R.A. from 0° to 30° and 190° to 212°, respectively.
Other Images in This Article
Show More
Copyright and Terms & Conditions
© 2026. The Author(s). Published by the American Astronomical Society.

Copyright ©
2026 Astronomy Image Explorer. All Rights Reserved.
