

Image Details
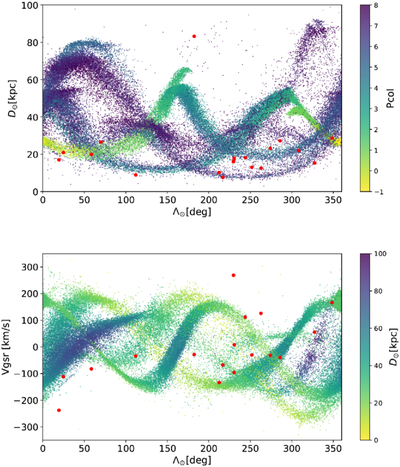
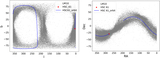
Caption: Figure 2.
The upper panel shows the distribution of GCs and LM10 particles in terms of distance vs. Λ⊙, with LM10 particles color-coded by Pcol to facilitate visualization of which arms the clusters lie on. The lower panel shows the distribution of GCs and LM10 particles in Vgsr vs. Λ⊙, where LM10 particles are color-coded by distance.
Other Images in This Article
Show More
Copyright and Terms & Conditions
© 2026. The Author(s). Published by the American Astronomical Society.

Copyright ©
2026 Astronomy Image Explorer. All Rights Reserved.
