

Image Details
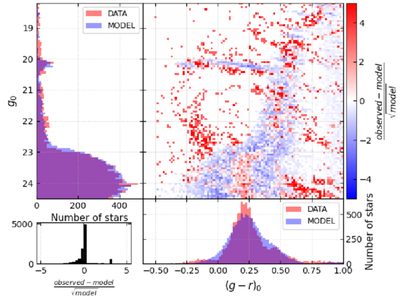
Caption: Figure 3.
Diagnostic CMD-fitting results for the Sextans dSph for one of the bootstrapping realizations. The top left panel shows the luminosity distribution (g0), comparing the observed data (red) and synthetic model (blue). The top right panel displays the significance of the residuals, defined as ﹩({\rm{o}}{\rm{b}}{\rm{s}}{\rm{e}}{\rm{r}}{\rm{v}}{\rm{e}}{\rm{d}}-{\rm{m}}{\rm{o}}{\rm{d}}{\rm{e}}{\rm{l}})/\sqrt{{\rm{m}}{\rm{o}}{\rm{d}}{\rm{e}}{\rm{l}}}﹩. The bottom panels provide the residuals distribution (left) and the color distribution (g − r)0 (right) comparing the data (red) and model (blue).
Other Images in This Article
Show More
Copyright and Terms & Conditions
© 2026. The Author(s). Published by the American Astronomical Society.

Copyright ©
2026 Astronomy Image Explorer. All Rights Reserved.
