

Image Details
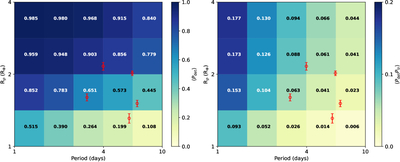
Caption: Figure 3.
The average detection sensitivity map (left panel) and the full completeness (i.e., detection sensitivity and transit probability) map (right panel) as a function of orbital period and planet radius. The number in each cell represents the average detection probability across all 132 targets. The red circles with error bars indicate the five HSEs detected by our pipeline.
Other Images in This Article
Copyright and Terms & Conditions
© 2026. The Author(s). Published by the American Astronomical Society.

Copyright ©
2026 Astronomy Image Explorer. All Rights Reserved.
