

Image Details
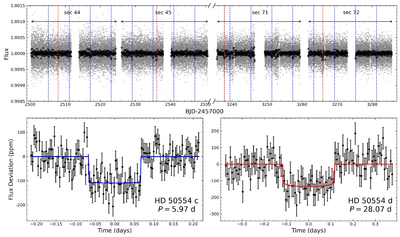
Caption: Figure 5.
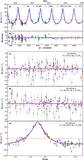
The TESS light curves of HD 50554. The top panel shows the flattened TESS light curves from Sectors 44, 45, 71, and 72. Gray points indicate short-cadence data with 2 minute sampling, and black points are 1 hr averages for visualization. Blue and red dashed lines mark the predicted midtransit times of HD 50554 c (TOI-6965.01) and d (TOI-6965.02), respectively. The bottom panels show the phase-folded light curve, along with the best-fitting model of HD 50554 c (left) and HD 50554 d (right). The black dots represent 5 minute averages in the left and 10 minute averages in the right.
Other Images in This Article
Copyright and Terms & Conditions
© 2026. The Author(s). Published by the American Astronomical Society.

Copyright ©
2026 Astronomy Image Explorer. All Rights Reserved.
