

Image Details
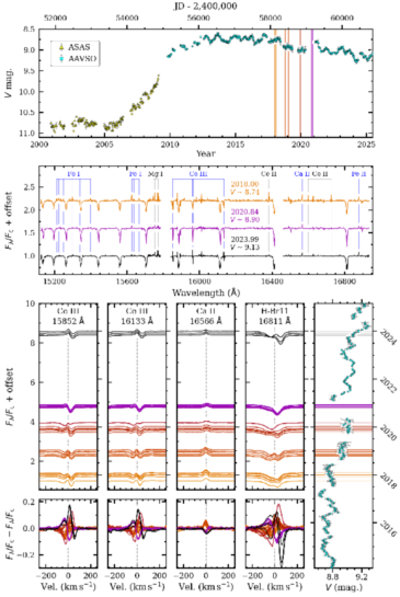
Caption: Figure 17.
Photometric and spectroscopic variability of the LMC LBV RMC 71 (=HD 269006) during the decline of its dramatic, multidecade outburst. Top panel: 25 yr of almost continuous ASAS and AAVSO V-band photometry that captured the almost 2.5 mag brightening. Vertical lines indicate APOGEE observation epochs, which took place near the apparent brightness peak. Middle panel: identification of some of the metal lines present in most of the APOGEE spectra. Shockingly, the strongest features throughout the spectra are Ce III lines, and these are also accompanied by Ce II lines in most epochs. Bottom panels: a detailed look at the perplexing variability of RMC 71 over the course of 2017−2024. Whereas the hydrogen and Ce III lines alternate from emission+absorption (2018–2020) to mostly absorption (late 2020) to inverse P Cygni (late 2023), lines from Ca II and Fe II maintain pure emission morphology throughout.
Other Images in This Article
Show More
Copyright and Terms & Conditions
© 2026. The Author(s). Published by the American Astronomical Society.

