

Image Details
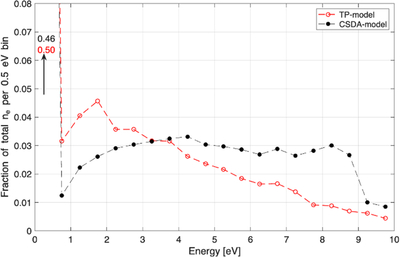
Caption: Figure 2.
Electron energy distribution at ﹩r=100﹩ km as calculated with ﹩Q=2\times {10}^{27}\,{{\rm{s}}}^{-1}﹩ and ﹩u=1\,{{\rm{km\, s}}}^{-1}﹩. Results from our model based on the continuous slowing-down approximation (CSDA) is shown in black while results from a test-particle (TP) model (as described in Section 5.2.2) is shown in red. The fractions of electrons in the lowest energy bin are, as indicated, ~0.46 and ~0.50, for the CSDA model and TP model, respectively.
Other Images in This Article
Copyright and Terms & Conditions
© 2026. The Author(s). Published by the American Astronomical Society.

Copyright ©
2026 Astronomy Image Explorer. All Rights Reserved.
