

Image Details
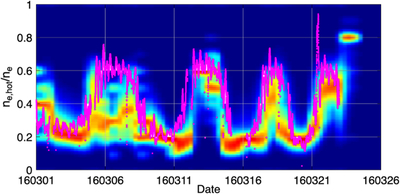
Caption: Figure 4.
Modeled fraction of hot electrons at the location of Rosetta versus date. The data is here plotted over ratios extracted from Figure 13 of G. Wattieaux et al. (2020). The dispersion of those results was in the original work computed and normalized over 6 hr intervals and the colors represent the occurrence (for details, see G. Wattieaux et al. 2020).
Other Images in This Article
Copyright and Terms & Conditions
© 2026. The Author(s). Published by the American Astronomical Society.

Copyright ©
2026 Astronomy Image Explorer. All Rights Reserved.
