

Image Details
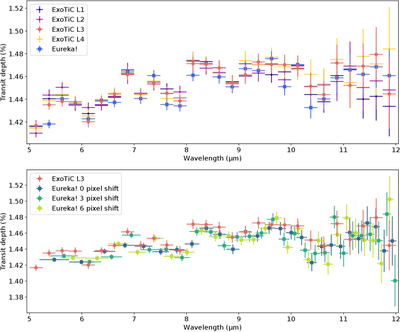
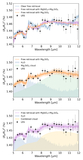
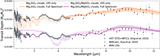
Caption: Figure A1.
Transmission spectra comparison for two independent pipelines: ExoTiC-MIRI and Eureka!. Top: for ExoTiC-MIRI we show all four of the “leaves” that make up the final ends of the tree of decisions considered in this paper, noting that L3 is the main result taken forward to our modeling stage, and the Eureka! spectrum decisions most closely matching L4 at the light-curve stage. Bottom: for Eureka! we show the data reduction extracted considering three different starting wavelengths (shown to be important at the light-curve fitting stage by K. B. Stevenson et al. 2025) compared to the ExoTiC-MIRIL3 spectrum.
Other Images in This Article
Show More
Copyright and Terms & Conditions
© 2026. The Author(s). Published by the American Astronomical Society.

