

Image Details
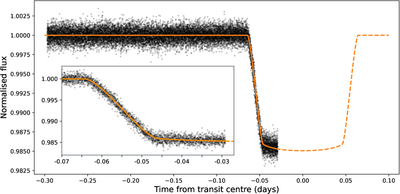
Caption: Figure 1.
Broadband light curve obtained by binning our 5–12 μm MIRI/LRS data. The start of the data is trimmed, leaving a long and stable pretransit baseline with minimal systematics. The best-fit transit model is shown in orange, where the dashed line represents an extrapolation of this model and depicts the missed transit information due to erroneous observation timing due to an incorrect orbital ephemeris. Inset panel: a zoom-in of the ingress data with the same axis labels as the main figure.
Other Images in This Article
Show More
Copyright and Terms & Conditions
© 2026. The Author(s). Published by the American Astronomical Society.

Copyright ©
2026 Astronomy Image Explorer. All Rights Reserved.
