

Image Details
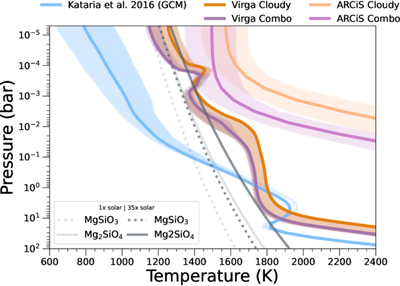
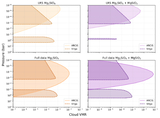
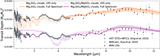
Caption: Figure 7.
Magnesium silicate cloud condensation curves (at 1× solar metallicity, faint lines; and best-fit Virga metallicity, dark lines), along with retrieved pressure–temperature profiles from the best fit, Mg2SiO4 (oranges) and combo (Mg2SiO4/MgSiO3, purples) ARCiS and Virga retrievals of the LRS+HST+NIRCam spectra, with shaded regions corresponding to the upper and lower 1σ bounds. Also shown is the range of pressure–temperatures from the HD 209458b GCM of T. Kataria et al. (2016) (blue), with the global average temperature shown in bold and shaded regions corresponding to the dayside and nightside temperatures.
Other Images in This Article
Show More
Copyright and Terms & Conditions
© 2026. The Author(s). Published by the American Astronomical Society.

