Image Details
Caption: Figure 4.
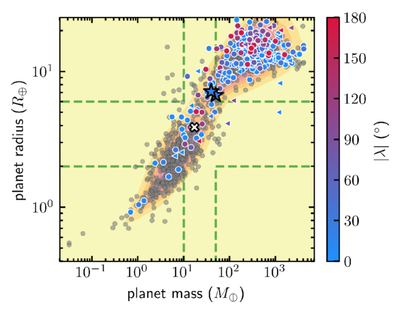
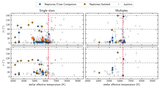
Mass vs. radius diagram. Gray points are all the transiting exoplanets from TEPCat (J. Southworth 2011) as of 2025 November. Colored points convey the projected obliquity for systems with published measurements. Triangles indicate systems with only upper limits available for the mass. TOI-181 b and TOI-883 b are highlighted as stars following the same color code. The green dashed lines indicate the region where 10 ≤ Mp/M⊕ ≤ 50 or 2 ≤ Rp/R⊕ ≤ 6, which we considered as Neptunes. Neptune itself is highlighted as the white cross. Contours show the density of points.
Other Images in This Article
Copyright and Terms & Conditions
© 2026. The Author(s). Published by the American Astronomical Society.
Copyright ©
2026 Astronomy Image Explorer. All Rights Reserved.