Image Details
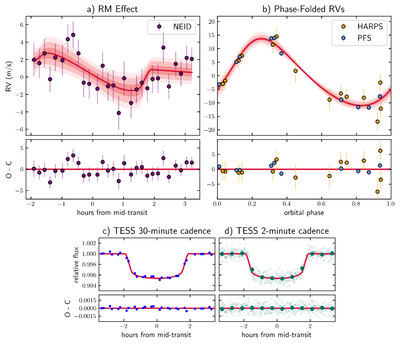
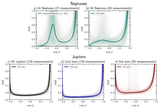
Caption: Figure 3.
RV and photometric observations of TOI-883. In all cases, the red curves are best-fit models, and the residuals are plotted beneath the data. The RV error bars include a white-noise jitter term added in quadrature. (a) NEID velocities spanning a transit and exhibiting the RM effect. (b) HARPS and PFS velocities across all orbital phases. (c) Phase-folded photometry based on TESS observations with 30-minute cadence (blue). (d) Phase-folded photometry based on TESS observations with 2-minute cadence (green). The darker points are time-averaged data. Data behind the figure are available electronically.
(The data used to create this figure are available in the online article.)
(The data used to create this figure are available.)
Other Images in This Article
Copyright and Terms & Conditions
© 2026. The Author(s). Published by the American Astronomical Society.