Image Details
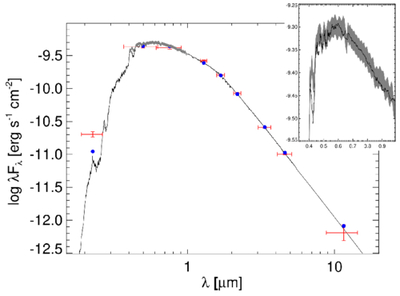
Caption: Figure 5.
SED of TOI-2155. Red symbols represent the observed photometric measurements, with horizontal bars indicating the effective passband width. Blue symbols are the model fluxes from the best-fit PHOENIX atmosphere model (black). The inset shows the Gaia spectrophotometry overlaid as a gray swathe.
Other Images in This Article
Show More
Copyright and Terms & Conditions
© 2026. The Author(s). Published by the American Astronomical Society.
Copyright ©
2026 Astronomy Image Explorer. All Rights Reserved.