Image Details
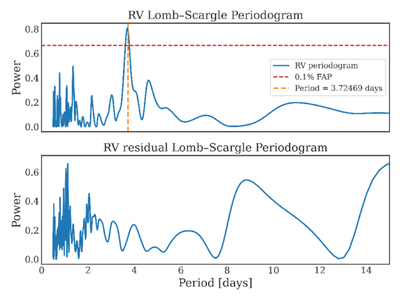
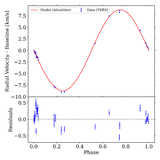
Caption: Figure 10.
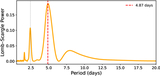
Lomb–Scargle periodograms of the RV measurements of TOI-2155 and of the residuals after subtracting the best-fitting orbital model. Top panel: Periodogram of the observed RV data. The dashed red horizontal line indicates the 0.1% false-alarm probability (FAP) threshold and the vertical dashed line marks the orbital period of P = 3.72469 days derived from the RV fit. The dominant peak at this period confirms the presence of the companion. Bottom panel: Periodogram of the RV residuals after removal of the orbital solution. No significant periodic signals are detected, indicating that the observed RV variability is well explained by the orbital motion of the companion.
Other Images in This Article
Show More
Copyright and Terms & Conditions
© 2026. The Author(s). Published by the American Astronomical Society.