Image Details
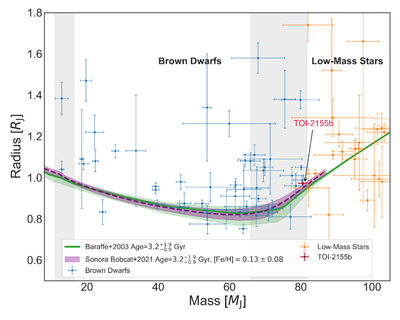
Caption: Figure 11.
Mass–radius diagram for known transiting BDs (blue circles) and low-mass stars (orange stars) between 12 and 110 MJ. TOI-2155 b is highlighted in red. The green solid line shows evolutionary models from I. Baraffe et al. (2003) at an age of ﹩3.{2}_{-0.9}^{+1.9}﹩ Gyr, with the shaded region indicating the corresponding age uncertainty. The purple dashed line shows Sonora Bobcat model (M. S. Marley et al. 2021) predictions, with uncertainties (shaded region) from age and metallicity. The gray shaded regions indicate the approximate transition mass ranges between giant planets and BDs (∼11–16.3 MJ; D. S. Spiegel et al. 2011) and between BDs and low-mass stars (∼66–81.7 MJ; C. V. Morley et al. 2024). The upper boundary of C. V. Morley et al. 2024 reflects model-dependent assumptions (e.g., metallicity and cloud properties), which do not apply to TOI-2155 b based on the evidence we have available until now. BDs follow a nearly flat mass–radius relation, while low-mass stars have larger radii due to sustained hydrogen fusion.
Other Images in This Article
Show More
Copyright and Terms & Conditions
© 2026. The Author(s). Published by the American Astronomical Society.