Image Details
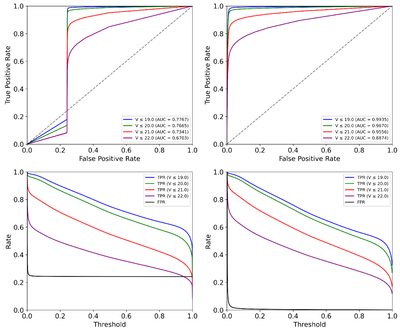
Caption: Figure 14.
(Top left) ROC curve for the labeled positives at V < 19 (blue), V < 20 (orange), V < 21 (green), and V < 22 (red). The black-dashed diagonal line is at FPR = TPR for reference. (Top right) Same as top left, but without threshold bins >0.999 or <0.001. (Bottom left) Threshold versus TPR and FPR rates, with colors the same as above for TPR. FPR is shown in black. (Bottom right) Same as bottom left, but without threshold bins >0.999 or <0.001.
Other Images in This Article
Show More
Copyright and Terms & Conditions
© 2026. The Author(s). Published by the American Astronomical Society.
Copyright ©
2026 Astronomy Image Explorer. All Rights Reserved.