Image Details
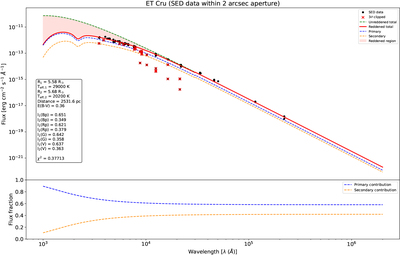
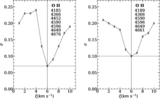
Caption: Figure 12.
SED of ET Cru constructed from multiwavelength photometric data. Black circles represent the observed fluxes, and red crosses indicate data points excluded by the 3σ clipping procedure. The solid red curve shows the total reddened model SED, while the dashed green curve corresponds to the intrinsic (unreddened) SED. The dashed blue and orange curves illustrate the individual flux contributions of the primary and secondary components, respectively. The model adopts a single distance of ∼2.5 kpc, which provides a significantly better agreement with the observed SED than the distance inferred from the Gaia parallax.
Other Images in This Article
Show More
Copyright and Terms & Conditions
© 2026. The Author(s). Published by the American Astronomical Society.