

Image Details
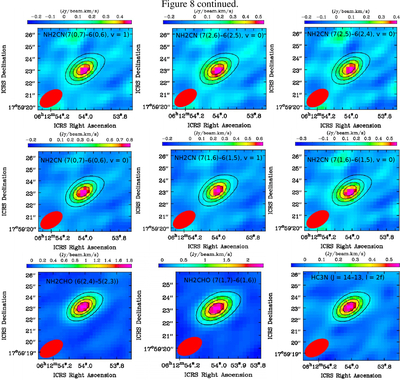
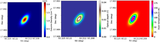
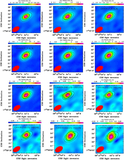
Caption: Figure 8.
Integrated emission maps (moment zero) of nonblended transitions of CH3CN, C2H5CN, C2H3CN, NH2CN, NH2CHO, and HC3N (ν7 = 2) toward NIRS3. The emission maps of detected N-bearing species are overlaid with the 2.29 mm continuum emission map (black contour). The contour levels are at 20%, 40%, 60%, and 80% of the peak flux. The red ellipses represent the synthesized beams of the emission maps.
Other Images in This Article
Show More
Copyright and Terms & Conditions
© 2026. The Author(s). Published by the American Astronomical Society.

Copyright ©
2026 Astronomy Image Explorer. All Rights Reserved.
