

Image Details
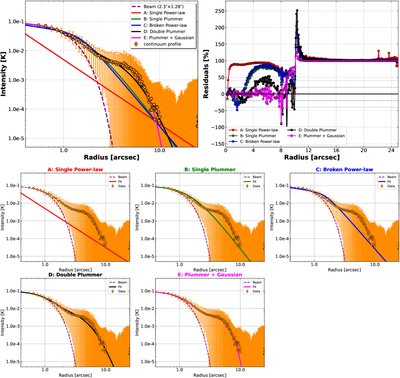
Caption: Figure 2.
Left panel: radial intensity profile of NIRS3 at 2.32 mm (orange circles with error bars showing the rms azimuthal scatter). The dashed purple curve shows the beam profile (2﹩\mathop{.}\limits^{\unicode{x02033}}﹩30 × 1﹩\mathop{.}\limits^{\unicode{x02033}}﹩28). Colored lines represent the best-fit models: single power law (red), single Plummer (green), broken power law (blue), double Plummer (black), and Plummer + Gaussian (magenta). Right panel: residuals (data – model) expressed as a percentage of the data for each model. Lower panels: individual fits of all five models.
Other Images in This Article
Show More
Copyright and Terms & Conditions
© 2026. The Author(s). Published by the American Astronomical Society.

Copyright ©
2026 Astronomy Image Explorer. All Rights Reserved.
