

Image Details
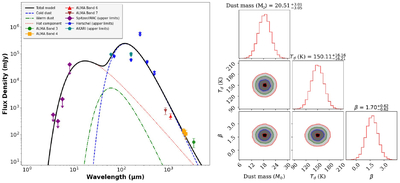
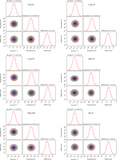
Caption: Figure 3.
SED of NIRS3 covering the wavelength range from 3.6 to 3443 μm. The black curve represents the best-fit SED obtained from the radiative transfer model of T. P. Robitaille (2017). The right panel shows a corner diagram demonstrating the results of our MCMC parameter estimation for the SED model. The 1D histograms on the diagonal show the marginalized posterior densities of mass, dust temperature, and β. The off-diagonal panels indicate 2D projections of the posterior probability distributions for each pair of parameters.
Other Images in This Article
Show More
Copyright and Terms & Conditions
© 2026. The Author(s). Published by the American Astronomical Society.

Copyright ©
2026 Astronomy Image Explorer. All Rights Reserved.
