

Image Details
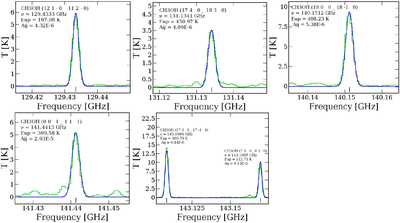
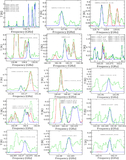
Caption: Figure A1.
Detected rotational emission lines of CH3OH toward NIRS3. The green lines indicate the observed molecular spectra of NIRS3, and the blue lines represent the LTE model spectra of CH3OH. The optical depths (τ) of the detected CH3OH transitions range from 5 × 10⁻² to 8 × 10⁻².
Other Images in This Article
Show More
Copyright and Terms & Conditions
© 2026. The Author(s). Published by the American Astronomical Society.

Copyright ©
2026 Astronomy Image Explorer. All Rights Reserved.
