

Image Details
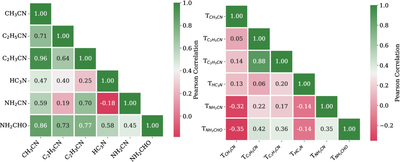
Caption: Figure 11.
Pearson correlation coefficient heat maps of the abundances relative to CH3OH (left panel) and excitation temperatures (right panel) of the identified N-bearing molecules. The colors show the level of correlation, which corresponds to the Pearson coefficient (r) shown in each box.
Other Images in This Article
Show More
Copyright and Terms & Conditions
© 2026. The Author(s). Published by the American Astronomical Society.

Copyright ©
2026 Astronomy Image Explorer. All Rights Reserved.
