Image Details
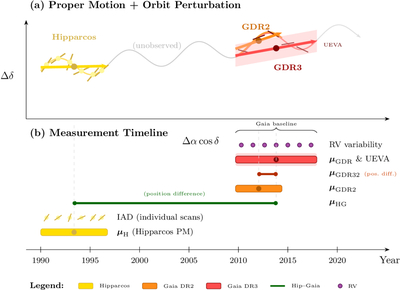
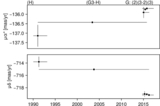
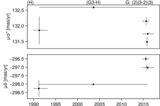
Caption: Figure 1.
Conceptual schematic (not to scale) showing how the different datasets correspond to different time ranges. Linear sky motion is shown without the addition of annual parallax. The proper motions for each data source result from published linear fits to the perturbed motion over different time windows (T. D. Brandt 2018; P. Kervella et al. 2019). The unbiased estimator of variance (UEVA) Gaia astrometric excess-noise constraint is deduced from the published uncertainty inflation applied within the GDR3 linear fit (F. Kiefer et al. 2025). The RV variability is deduced from the uncertainty in the published mean Gaia RV of the star, itself calculated from the sample variance over the GDR3 baseline (Q. Chance et al. 2025) The two scaled position differences, μHG and μDR32, are calculated from the displacements over the time intervals between the Hipparcos and GDR3 positions (sourced from the HGCA), and between the GDR2 and GDR3 positions, respectively. The IAD is the only dataset for which the individual measurements are available for modeling. The net proper motion and positions of the IAD are marginalized over to avoid double-counting with the HGCA.
Other Images in This Article
Show More
Copyright and Terms & Conditions
© 2026. The Author(s). Published by the American Astronomical Society.