Image Details
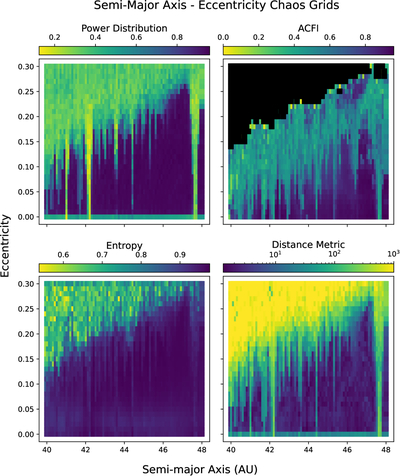
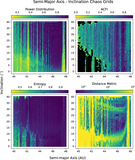
Caption: Figure 9.
Stability indicators computed across a grid of particles as a function of semimajor axis and eccentricity. The color of each point gives the median value of the indicator across all inclinations for the particles in each a-e bin. Color bars are scaled so that yellow/brighter colors indicate chaos/instability, with bluer/darker colors indicating regularity/stability. Scattered objects have unusual ACFI values and are colored black.
Other Images in This Article
Show More
Copyright and Terms & Conditions
© 2026. The Author(s). Published by the American Astronomical Society.
Copyright ©
2026 Astronomy Image Explorer. All Rights Reserved.