Image Details
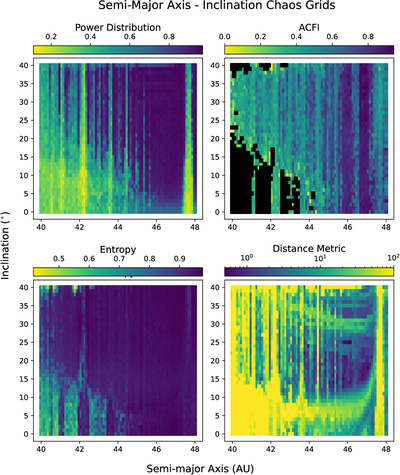
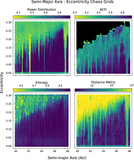
Caption: Figure 10.
Stability indicators computed across a grid of particles as a function of semimajor axis and inclination. The color of each point gives the median value of the indicator across all eccentricities for the particles in each a-I bin. Color bars are scaled slightly differently to those in Figure 9, but with the same sense (brighter is more chaotic).
Other Images in This Article
Show More
Copyright and Terms & Conditions
© 2026. The Author(s). Published by the American Astronomical Society.
Copyright ©
2026 Astronomy Image Explorer. All Rights Reserved.