Image Details
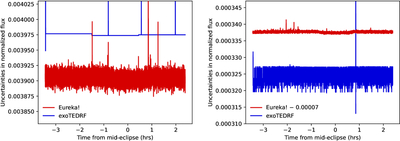
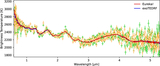
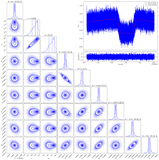
Caption: Figure A1.
Left: comparison of uncertainties in the 100th spectroscopic lightcurve from Eureka! and exoTEDRF. Right: same comparison for the white lightcurves. exoTEDRF shows mostly constant uncertainties with occasional large fluctuations. In the white lightcurves, the fluctuations dominate, reducing the difference between the two pipelines.
Other Images in This Article
Show More
Copyright and Terms & Conditions
© 2026. The Author(s). Published by the American Astronomical Society.
Copyright ©
2026 Astronomy Image Explorer. All Rights Reserved.