Image Details
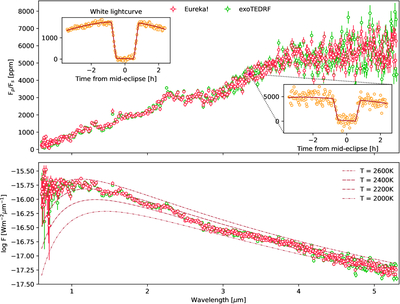
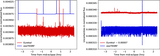
Caption: Figure 1.
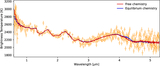
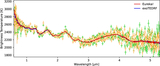
Top: spectroscopic planet-to-star flux ratios with 1σ uncertainties, derived from two independent reductions of the NIRSpec/PRISM data using Eureka! and exoTEDRF, followed by the modeling of the spectroscopic secondary-eclipse lightcurves. The white lightcurve and the 196th spectroscopic lightcurve (Eureka!, both binned to 2 minute cadence for clarity) are shown along with their respective best-fit secondary-eclipse models. Bottom: planetary emission spectra, normalized to the observer’s location, derived from the planet-to-star flux ratios above and modeled PHOENIX stellar spectrum. The mean absolute difference between the two independently reduced spectra is ∼1σ, indicating excellent statistical consistency. For reference, blackbody curves corresponding to 2600, 2400, 2200, and 2000 K are also shown. The significant deviation of the planet’s spectra from blackbody expectations at shorter wavelengths is due to the dominating contribution of the reflected starlight by the planet.
Other Images in This Article
Show More
Copyright and Terms & Conditions
© 2026. The Author(s). Published by the American Astronomical Society.