Image Details
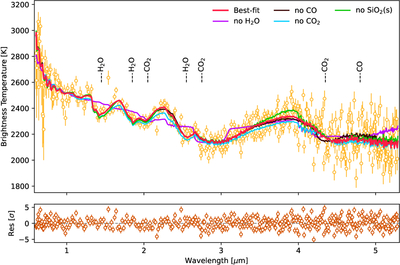
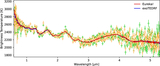
Caption: Figure 2.
The observed emission spectrum of WASP-19b in terms of brightness temperatures (orange, Eureka!) is shown, along with the best-fit free-chemistry retrieved model and the residuals. Retrieved models excluding individual species are also shown, which were used to assess the statistical significance of their detection. Key spectral features from H2O, CO, and CO2, each detected with strong statistical significance, are also highlighted for reference.
Other Images in This Article
Show More
Copyright and Terms & Conditions
© 2026. The Author(s). Published by the American Astronomical Society.
Copyright ©
2026 Astronomy Image Explorer. All Rights Reserved.