Image Details
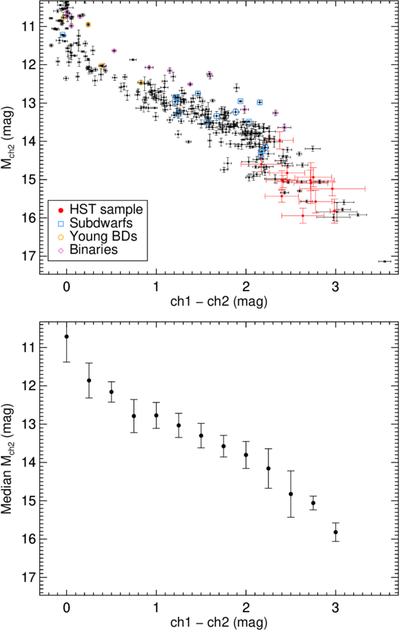
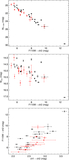
Caption: Figure 4.
Top: color–magnitude diagram for our sample compared to known nearby L, T, and Y dwarfs from the 20 pc census of J. D. Kirkpatrick et al. (2021). Our targets occupy the bottom of the main sequence, and further highlight the large photometric scatter among the coldest brown dwarfs. Bottom: median absolute Spitzer ch2 magnitude as a function of ch1–ch2 color, in bins of 0.25 mag. The error bars represent the 1σ scatter in the same bins.
Other Images in This Article
Copyright and Terms & Conditions
© 2026. The Author(s). Published by the American Astronomical Society.
Copyright ©
2026 Astronomy Image Explorer. All Rights Reserved.