Image Details
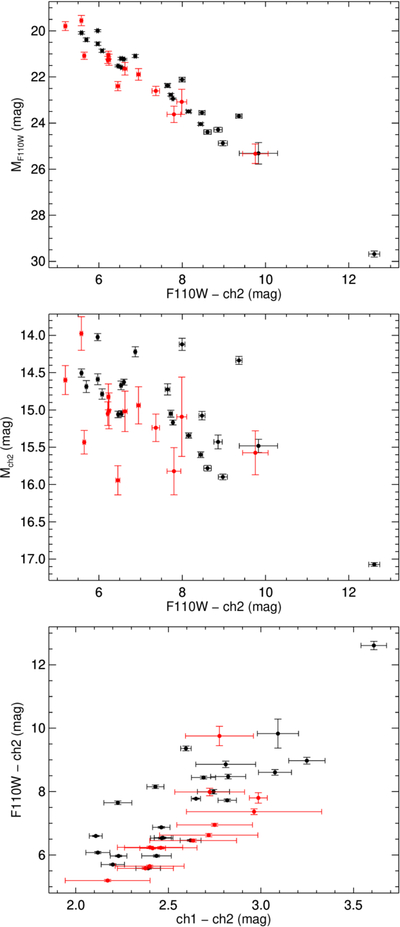
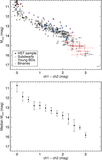
Caption: Figure 6.
Color–magnitude diagrams for our sample (red points) compared to known nearby T and Y dwarfs (black points) from (A. C. Schneider et al. 2015). Top: absolute F110W magnitude as a function of F110W–ch2 color. The sample stretches over nearly 10 mag in absolute magnitude, and 7.5 mag in color, clearly showing the rapid collapse of short-wavelength emission in these very cold substellar objects. Middle: Absolute ch2 magnitude as a function of F110W–ch2 color. The sequence spans “only” ∼2 mag in absolute magnitude, but shows larger intrinsic scatter, matching the spectroscopic diversity observed in MIR spectra (see e.g., S. A. Beiler et al. 2024). Bottom: F110W–ch2 color versus ch1–ch2 color. Objects with similar ch1–ch2 can have F110W–ch2 colors spanning almost 3.5 mag.
Other Images in This Article
Copyright and Terms & Conditions
© 2026. The Author(s). Published by the American Astronomical Society.