Image Details
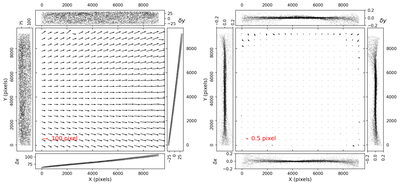
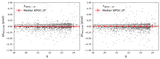
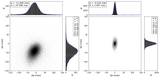
Caption: Figure 6.
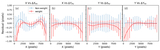
The GD maps for the uncorrected (left) and GD solution accuracy of WPDC-2P result (right). All positional offsets are compared with the mock reference catalog for 25 different fields observed with the same g-1 detector. In each panel, the two-dimensional residual patterns are averaged over 20 × 20 grid cells and magnified by factors of 5 and 200, respectively. The surrounding four subpanels display the δx and δy residuals as functions of the detector coordinates (XPSF, YPSF), where only 5% of the residual sample is randomly selected for clarity.
Other Images in This Article
Copyright and Terms & Conditions
© 2026. The Author(s). Published by the American Astronomical Society.
Copyright ©
2026 Astronomy Image Explorer. All Rights Reserved.