Image Details
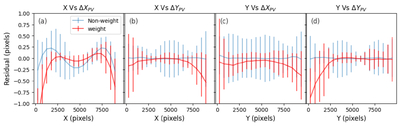
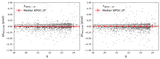
Caption: Figure 5.
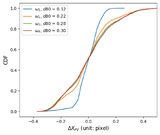
Positional residuals (ΔXPV, ΔYPV) obtained after the third-order PV parameter fitting. The blue and red points represent the mean residuals of nonweighted and weighted solutions, respectively, computed in slices of 512 pixels. The corresponding blue and red error bars are defined as the 68.27th percentile of the residual distribution (after a 3σ clipping). However, overweighting the central region results in systematic deviations of the GD correction at the edges, with larger central-to-edge weight differences producing greater accuracy errors. All the sources shown have S/N > 10 in the g-1 detector.
Other Images in This Article
Copyright and Terms & Conditions
© 2026. The Author(s). Published by the American Astronomical Society.