Image Details
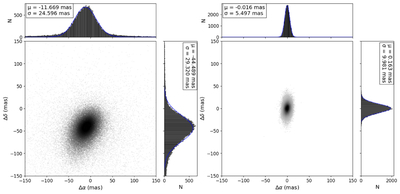
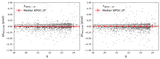
Caption: Figure 10.
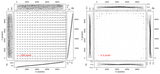
Performance comparison of GD correction results on 10 exposures (each with two g-band images and r-band images) of the BASS dataset with Gaia DR3. Left: GD solution of traditional SCAMP result in released catalogs with 48,256 matched stars. Right: our method with 49,158 matched stars. The weighted polynomial corrected stellar positions achieved a mean error (μΔα, μΔδ) = (0.016, 0.163) mas and standard deviation (σΔα, σΔδ) = (5.494, 9.981) mas, compared to the original BASS pipeline results (μΔα, μΔδ) = ( −11.669, −44.489) mas, (σΔα, σΔδ) = (24.596, 29.320) mas. The side and top panels show the histograms of Δα and Δδ, respectively, with Gaussian fits overlaid.
Other Images in This Article
Copyright and Terms & Conditions
© 2026. The Author(s). Published by the American Astronomical Society.