Image Details
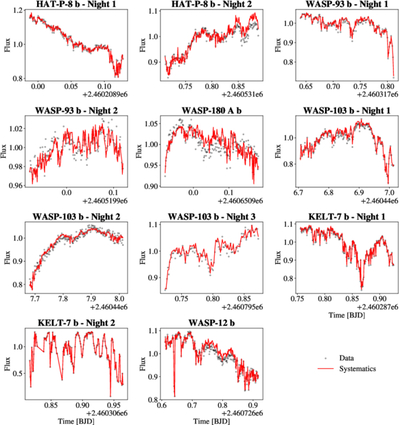
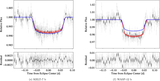
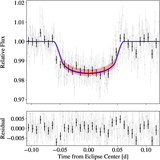
Caption: Figure 9.
White light curves and systematics models for all survey targets, with each night of observation displayed separately. Black points correspond to the sigma-clipped flux in the optimal aperture. Red lines represent the systematics model, which comprises a linear trend in time, a linear combination of comparison star light curves, and a combination of additional covariates (airmass, the distance from the median centroid, the PSF width, the time-varying telluric water absorption proxy, no covariates) that minimize the BIC (see Section 2.3 for more information).
Other Images in This Article
Show More
Copyright and Terms & Conditions
© 2026. The Author(s). Published by the American Astronomical Society.
Copyright ©
2026 Astronomy Image Explorer. All Rights Reserved.