Image Details
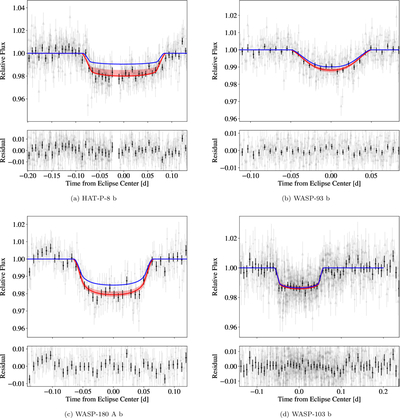
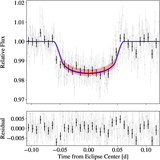
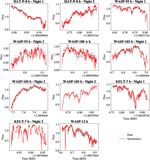
Caption: Figure 3.
Transit light curves (top panels) and residuals (bottom panels) for the six planets in our survey. The detrended data (gray points, different nights have different symbol shapes) are binned to 10 minutes cadence and overplotted as black circles. Our best-fit transit models are overplotted as red lines, with red shading indicating the corresponding 1σ uncertainty. The blue curves show the predicted light curve models for the case where there is no outflow.
Other Images in This Article
Show More
Copyright and Terms & Conditions
© 2026. The Author(s). Published by the American Astronomical Society.
Copyright ©
2026 Astronomy Image Explorer. All Rights Reserved.