Image Details
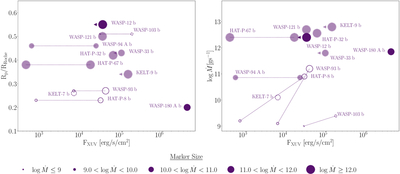
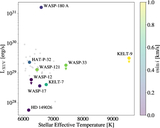
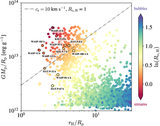
Caption: Figure 5.
Left panel: Roche filling factor as a function of XUV flux at the planet’s orbit for survey targets and planets orbiting early-type stars with published mass-loss measurements. Filled circles correspond to robust (≥3σ) detections of atmospheric escape, open circles correspond to tentative (≤2σ) detections of atmospheric escape, and open circles with dashed edges indicate nondetections. Published detections are shown as a lighter shade of purple. Point size is proportional to the retrieved mass-loss rate, indicated by the legend. The published XUV luminosities for WASP-12 and KELT-9 are upper bounds, and therefore, the XUV fluxes at the planets’ orbits are also upper bounds, which we symbolize here with horizontal arrows. We similarly indicate that the XUV flux at the orbit of WASP-33 b is also an upper bound, which we derived from an unpublished XMM-Newton observation, as detailed in Appendix C. We have indicated with arrows that the actual XUV flux may be higher or lower than this estimate. For F-type stars without published XUV luminosities (HAT-P-67, HAT-P-8, WASP-93, WASP-103, and WASP-94 A), we plot two points connected by a dashed line. The lower bound corresponds to a flux calculated using the proxy star XUV luminosity (see Table 5 for proxy star choice) and the upper bound corresponds to a flux calculated using the XUV luminosity of HAT-P-32. Palomar survey targets in this set (HAT-P-8, WASP-93, and WASP-103) have point sizes corresponding to the retrieved mass-loss rates calculated at each luminosity value. Right panel: retrieved mass-loss rates as a function of XUV flux at the planet’s orbit.
Other Images in This Article
Show More
Copyright and Terms & Conditions
© 2026. The Author(s). Published by the American Astronomical Society.