Image Details
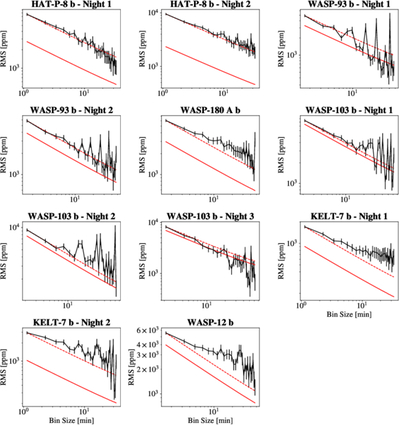
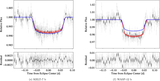
Caption: Figure 10.
rms vs. bins plots for all survey targets, with each night of observation displayed separately. Each plot contains the rms of the binned residuals (black points), the noise expected from photon noise statistics (red solid line), and the expected noise rescaled to match the rms of the unbinned residuals (dashed red line).
Other Images in This Article
Show More
Copyright and Terms & Conditions
© 2026. The Author(s). Published by the American Astronomical Society.
Copyright ©
2026 Astronomy Image Explorer. All Rights Reserved.