Image Details
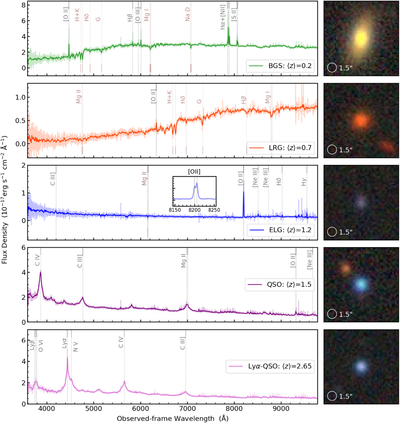
Caption: Figure 7.
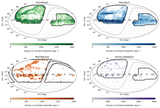
Composite spectra and example LS images of the extragalactic target classes. The left-hand panel of each row shows the average of 75–100 spectra in a narrow redshift slice around the mean redshift value labeled in the lower-right of each panel. For the BGS, LRG, and ELG target classes, we use a bin width of Δz/(1 + z) = 10−5, and for the QSO and Lyα QSO target classes, we use Δz/(1 + z) = 3 × 10⁻⁵. The faint colored lines represent the inverse-variance-weighted average spectra, while the darker lines are the same spectra smoothed with a five-pixel Gaussian kernel. The vertical dotted lines indicate the expected wavelengths of key emission and absorption lines, and for the ELG class, the inset shows the resolved [O II] λλ3726, 29 doublet. The right-hand panel of each row features a g, r, z color image of one representative object from each target class, with the fiber diameter of 1﹩\mathop{.}\limits^{\unicode{x02033}}﹩5 drawn to scale.
Other Images in This Article
Copyright and Terms & Conditions
© 2026. The Author(s). Published by the American Astronomical Society.