Image Details
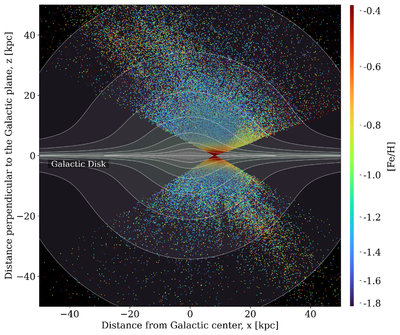
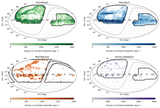
Caption: Figure 2.
Distribution of Milky Way stars in DESI DR1 observed as part of the MWS. The colors of individual points represent the spectroscopically inferred iron abundance, [Fe/H], as measured using the RVSPecFit pipeline (see Appendix F and S. E. Koposov et al. 2024). The distances to individual stars have been derived using a neural network with stellar parameters as inputs. The thin curves represent the disk stellar mass density contours from the A. M. Price-Whelan (2017) MilkyWayPotential2022 Galactic model. This visualization illustrates the phenomenal size and scale of the DESI stellar survey, the clear negative iron abundance gradient (from the inner disk to the outer stellar halo), as well as the presence of the Sagittarius stream (S. R. Majewski et al. 2003), visible as more orange-tinted points at (x, z) ≈ ( −10, +40) kpc and (x, z) ≈ (20, −20) kpc above and below the Galactic disk, respectively. The map also shows high-metallicity stars extending above the disk at x = 20 kpc caused by the Monoceros “stream” structure (H. J. Newberg et al. 2002; M. Jurić et al. 2008).
Other Images in This Article
Copyright and Terms & Conditions
© 2026. The Author(s). Published by the American Astronomical Society.