Image Details
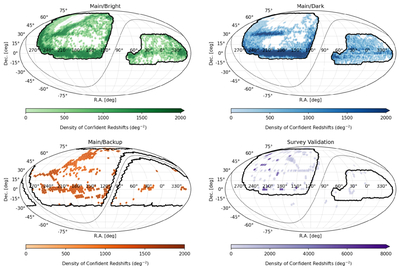
Caption: Figure 5.
Surface density of all unique targets with good redshifts observed in the bright, dark, and backup main-survey programs (first three panels), and in SV (lower-right panel), rendered using an equal-area Mollweide projection in equatorial coordinates. In each panel, the thin gray curve represents the Galactic plane, which divides the DESI footprint into its north and south Galactic cap regions (shown as thick black outlines; see Figure 3). The density of targets in the bright- and dark-time programs extends to above 2000 deg−2, compared to the (as-designed) > 8000 deg−2 surface density of targets in SV.
Other Images in This Article
Copyright and Terms & Conditions
© 2026. The Author(s). Published by the American Astronomical Society.