Image Details
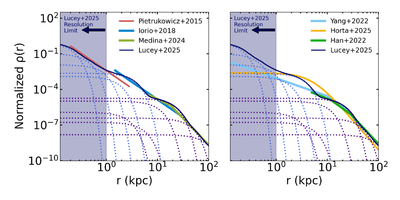
Caption: Figure 4.
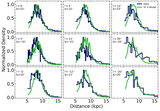
The normalized halo density profile of RRL as a function of distance from the Galactic center (r) for our GMM compared to literature results using RRL (left) and other tracers (right). In both panels, the light purple dotted lines indicate the five components of the inner Galaxy mixture model while the dark purple dotted lines show the halo components. The dark blue solid line is their sum. The literature RRL profiles included in the left panel are P. Pietrukowicz et al. (2015; red), G. Iorio et al. (2018; blue), and G. E. Medina et al. (2024; green). The works in the right panel, D. Horta & R. P. Schiavon (2025; yellow), J. J. Han et al. (2022; green), and C. Yang et al. (2022; light blue), use red-giant stars.
Other Images in This Article
Copyright and Terms & Conditions
© 2026. The Author(s). Published by the American Astronomical Society.