Image Details
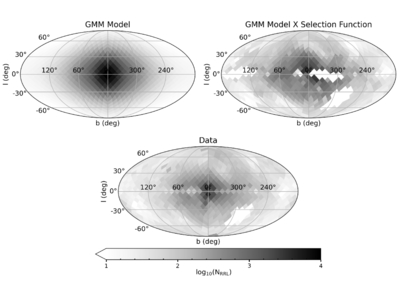
Caption: Figure 3.
Comparison of the sky projected densities of our model to the data in Galactic coordinates (l, b). The top left panel is sky projection of our model where the darkest patches indicate the highest density of RRL. The top-right panel shows the same but convolved with our model for the selection function. The bottom panel shows the equivalent sky projection of the RRL sample used in this work. In general, the sky projected model is similar to the data when convolved with the selection.
Other Images in This Article
Copyright and Terms & Conditions
© 2026. The Author(s). Published by the American Astronomical Society.
Copyright ©
2026 Astronomy Image Explorer. All Rights Reserved.