Image Details
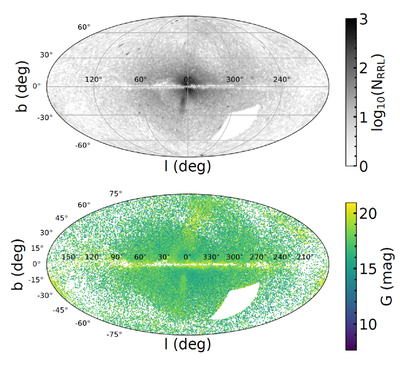
Caption: Figure 1.
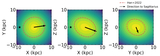
The sky distribution in Galactic coordinates (l, b) of our RRL sample. The top panel shows the log density for the 105,325 RRL we use in this work, after removing the LMC and SMC with a cut in R.A. and decl. The bottom panel shows the sky distribution of our final sample colored by the Gaia G magnitude, which, because of their standard-candle nature, is strongly correlated with the distance.
Other Images in This Article
Copyright and Terms & Conditions
© 2026. The Author(s). Published by the American Astronomical Society.
Copyright ©
2026 Astronomy Image Explorer. All Rights Reserved.