Image Details
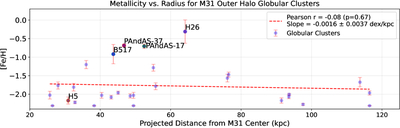
Caption: Figure 9.
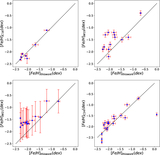
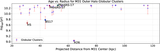
Distribution of 29 globular clusters: projected distance versus metallicity. Red error bars represent the measurement uncertainties. The red dashed line indicates the linear fit, with the slope, Pearson coefficient (r), and p-value displayed in the legend.
Other Images in This Article
Copyright and Terms & Conditions
© 2026. The Author(s). Published by the American Astronomical Society.
Copyright ©
2026 Astronomy Image Explorer. All Rights Reserved.