Image Details
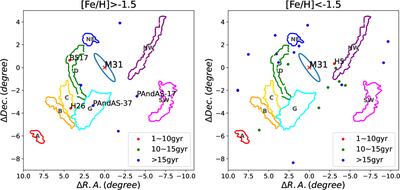
Caption: Figure 11.
Spatial distribution of 29 sample clusters overlaid on the M31 stellar substructure map from A. D. Mackey et al. (2010; their Figure 3). Substructures are labeled as follows: Streams A—D; Giant Stream (G); NE structure (NE); NW Stream (NW); and SW Cloud (SW). The panels divide the sample by metallicity: metal-rich ([Fe/H] > −1.5, left) and metal-poor ([Fe/H] = −1.5, right). Symbol colors indicate age: red (<10 Gyr), green (10–15 Gyr), and blue (>15 Gyr). Labeled clusters are discussed in detail in the text.
Other Images in This Article
Copyright and Terms & Conditions
© 2026. The Author(s). Published by the American Astronomical Society.
Copyright ©
2026 Astronomy Image Explorer. All Rights Reserved.